
- How do you improve data quality in your organisation?
- What is data governance and how do you record ownership?
- How do you build a data strategy that works in practice?
- What does a Chief Data Officer actually do?
- How do you get your data in order before starting with AI?
- How do you build dashboards whose numbers actually hold?
How do you improve data quality in your organisation?
Not by starting with a tool, but with a baseline: where do you stand now, per source and per definition. Then you record who owns which data and which standards apply. The Metro model splits that into a strategic, tactical and operational layer, so you know which measure belongs at which level.
11 episodes, articles and cases

Episode 1
Improve your own data quality with the Metro model
Guest: Peter van Nederpelt en Marco Heij
Episode 2
The operational layer of data quality in the Metro model
Guest: Aris Prins
Episode 4
The strategic data quality layer of the Metro model
Guest: Vincent Lassauw
Episode 5
The tactical data quality layer of the Metro model
Guest: Ruud Kuil
Episode 6
Working together on data quality: from strategy to practice in data management
Guest: Nico Kohlberg en René Wiertz Read
Read Article
How do you improve your own data quality with the Metro model?
 Read
Read Article
Why does a data quality strategy start with a baseline?
 Read
Read Article
What happens in the upper operational layer of data quality?
 Read
Read Article
What happens in the operational layer of data quality?
 Read
Read Article
How do you steer on data quality at a strategic level?
 Read
Read Article
How do you use a standards framework as architecture for data quality?
What is data governance and how do you record ownership?
Data governance is not a control mechanism but an agreement about who owns what. Per data item you record who defines it, who maintains it and who may use it. Without metadata that stays abstract, which is why a catalogue is usually the first concrete step.
9 episodes, articles and cases

Episode 7
The power of leadership and collaboration in data management
Guest: Mark van der Veen
Episode 8
Metadata deep dive
Guest: Shannon Els
Episode 9
Building data awareness as part of data governance
Guest: Frans Klaassen Read
Read Article
Why is data governance not a control mechanism?
 Read
Read Article
Why is metadata the foundation of data governance?
 Read
Read Article
How do you build data awareness in your organisation?
 Case
Case Case
How do you make an organisation AI-ready with data governance?
Microsoft Copilot, data catalogue Case
Case Case
How do you see in complaints data which process is costing you customers?
Power BI, legacy case system Answer
What is data quality and how do you measure it?
How do you build a data strategy that works in practice?
By tying it to goals that already exist, instead of writing a separate document. A data strategy that cannot be traced back to the business strategy stays on the shelf. Start small and visible, with a problem people already feel, and expand from there.
5 episodes, articles and cases

Episode 11
Effective data strategy: from theory to practice
Guest: Henk Breunissen en Luuk Pauwels
Episode 12
Data strategy in practice
Guest: Jaap Franse en Henk Breunissen
Episode 13
The bridge between data strategy and data quality in practice
Guest: Julien Case
Case Case
How do you steer fundraising on data instead of on instinct?
Ifunds Engage, Dynamics 365, Power BI Answer
When should you move from Excel to Power BI?
What does a Chief Data Officer actually do?
A CDO connects the ambition of the board with what happens daily in the processes. That is less a technical role than a change to carry through: assigning ownership, getting definitions agreed, and making sure the organisation keeps it up once the attention moves on.
5 episodes, articles and cases
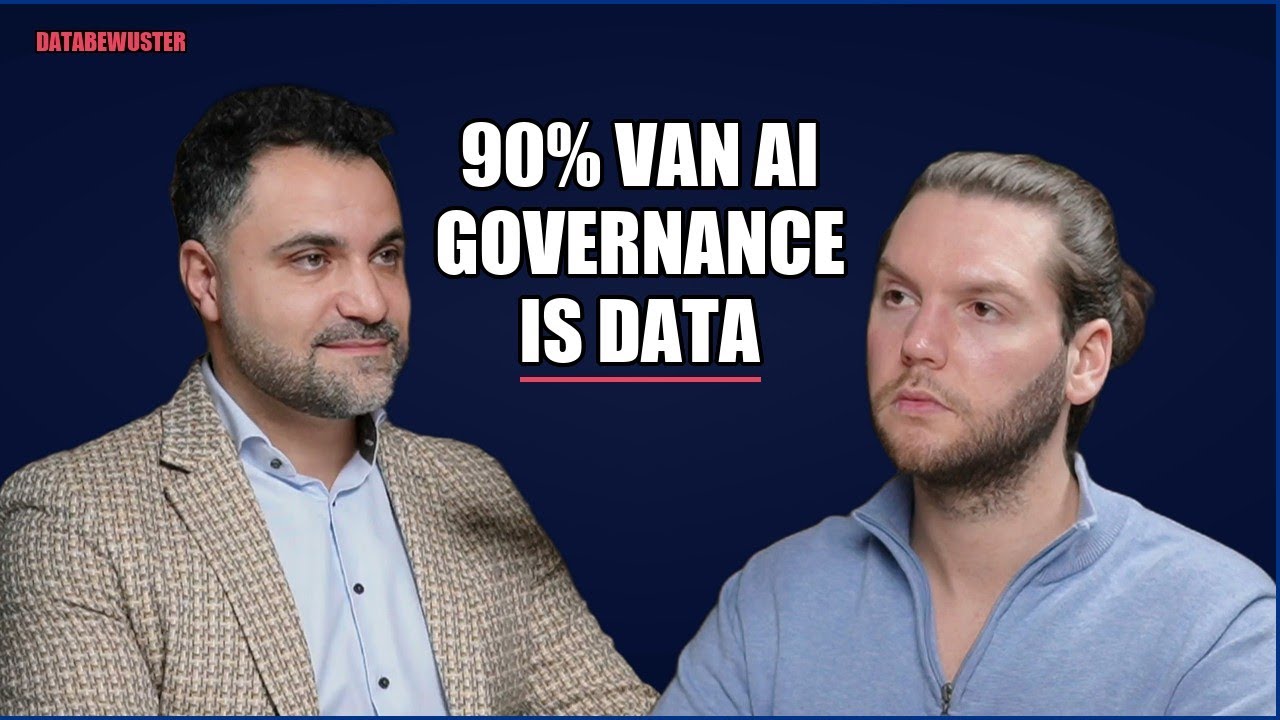
Episode 14
The CDO of the digital city
Guest: Mustafa Akpolat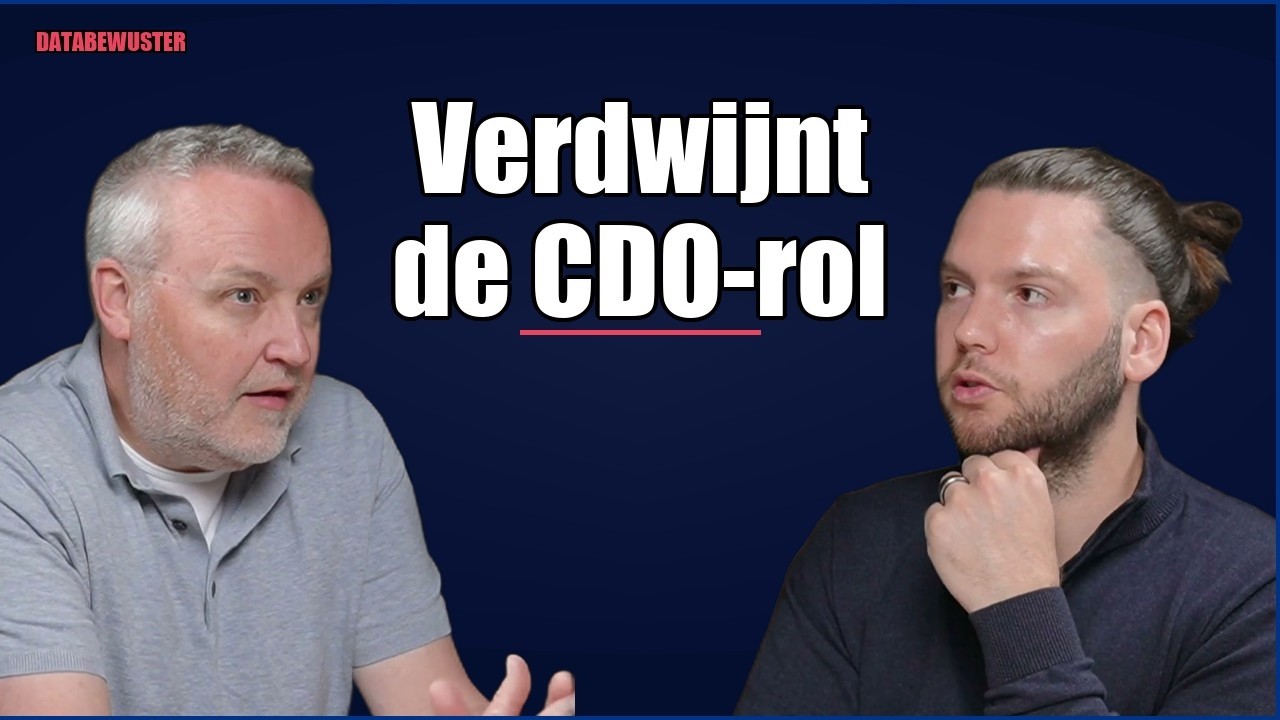
Episode 15
Data centricity: the road to success in the modern organisation
Guest: Aldwin Tito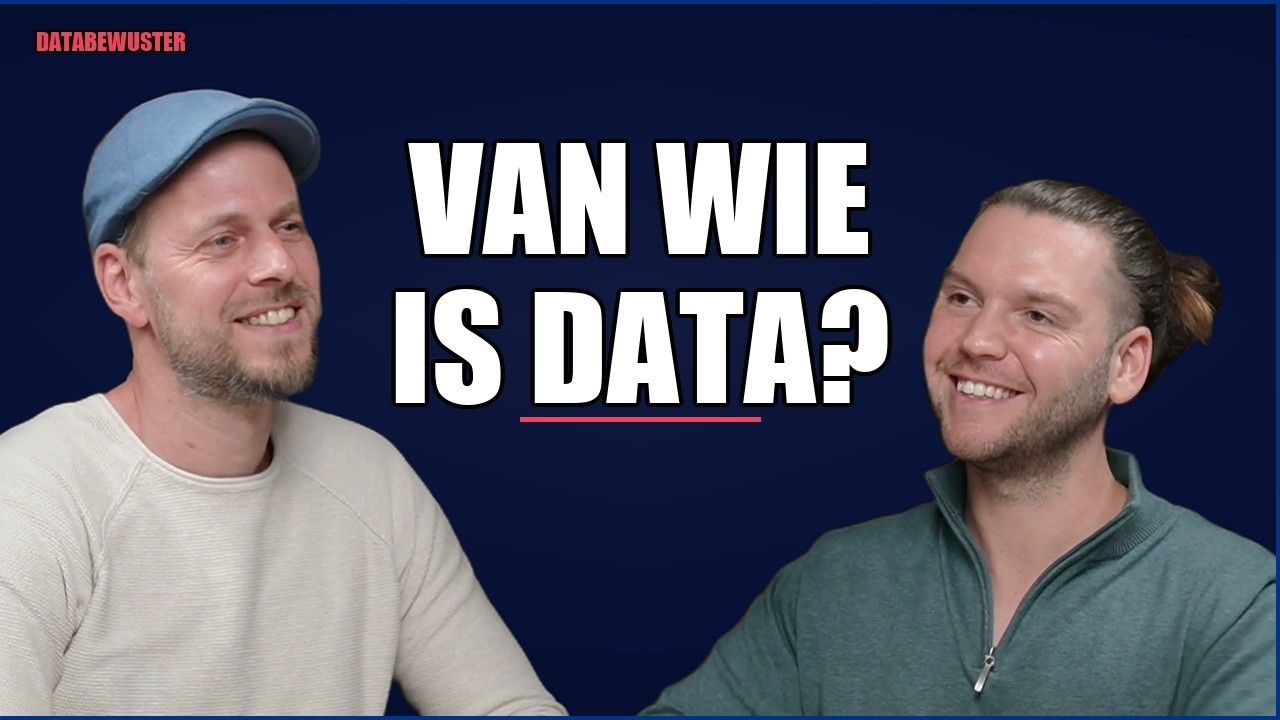
Episode 16
From civil engineering to CDO: a journey through data and social impact
Guest: Taeke van der Laan Case
Case Case
How do you get a team that works with data instead of requesting reports?
Power BI, Microsoft 365 Answer
Why is nobody using the dashboard?
How do you get your data in order before starting with AI?
AI only pays off on a solid data foundation. That means definitions that hold, data maintained structurally, and owners who feel responsible for it. Start small and visible rather than with a large programme, because a model on messy data mostly gives you wrong answers faster.
3 episodes, articles and cases
How do you build dashboards whose numbers actually hold?
By taking the business logic out of the report. Power BI should be purely the visualisation layer; definitions, data quality rules and calculations belong in the data layer underneath. If the logic sits in the report, every report builder makes their own version of revenue or margin, and the numbers drift apart by themselves.
10 episodes, articles and cases
 Case
Case Case
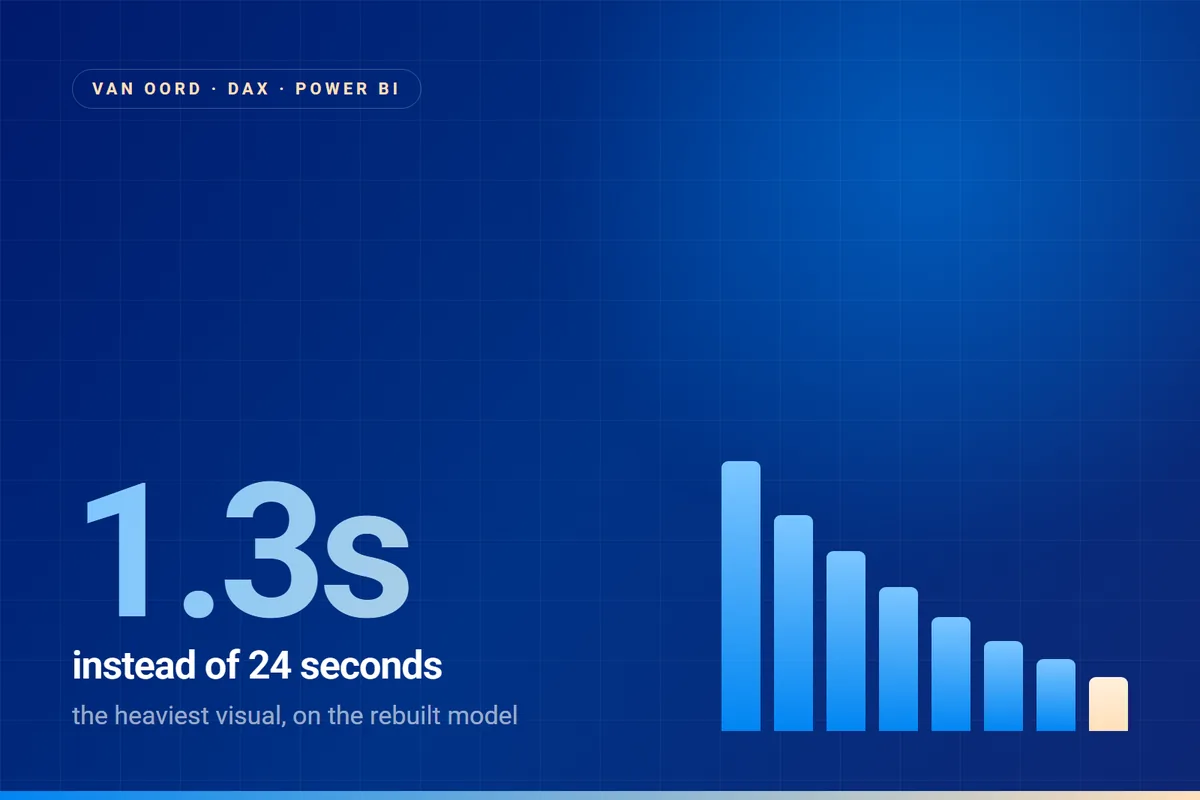
How do you take a Power BI report from 24 seconds to 1.3 seconds?
Power BI, DAX Studio, VertiPaq Analyzer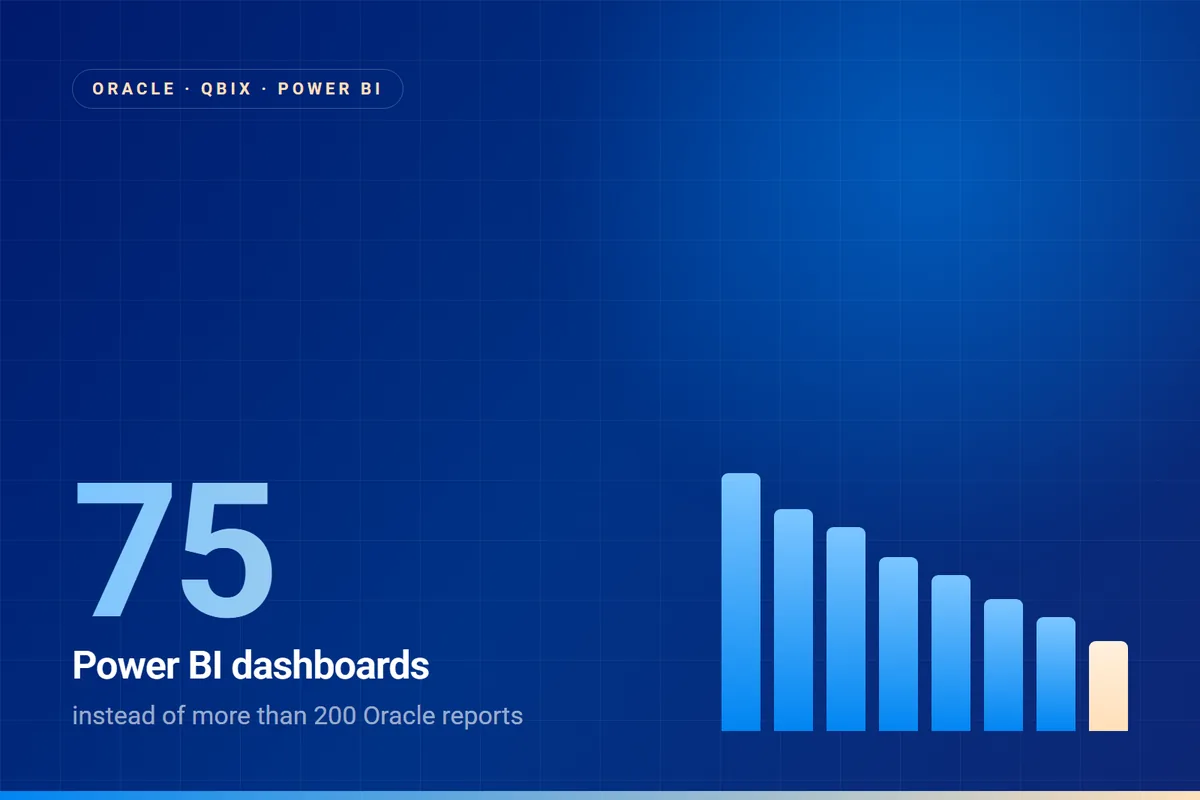 Case
Case Case
How do you migrate 200 Oracle reports into 75 Power BI dashboards?
Oracle, Power BI, SQL Server Case
Case Case
How do you get balance sheet, P&L and receivables straight out of Exact Online?
Exact Online, Power BI Case
Case Case
Which products can you profitably buy and sell on Bol.com?
Bol.com, Tweakers, SQL Server, Power BI Case
Case Case
What is your real margin per shipment, per contract, per unit?
ERP, Business Central, Power BI Case
Case Case
How do you connect production data and quality control in one dashboard?
Microsoft Fabric, Dataflows, Databricks, dbt, Power BI Answer
What should a Power BI data model look like?
Answer
Why is my Power BI report so slow?
Answer
Power Query, DAX or the source: where does logic belong?
Answer
How do you avoid depending on one builder?
Question not answered here?
Half an hour is enough to know whether we can help. No presentation.
Book half an hour