
Home › Cases
How do you take a Power BI report from 24 seconds to 1.3 seconds?
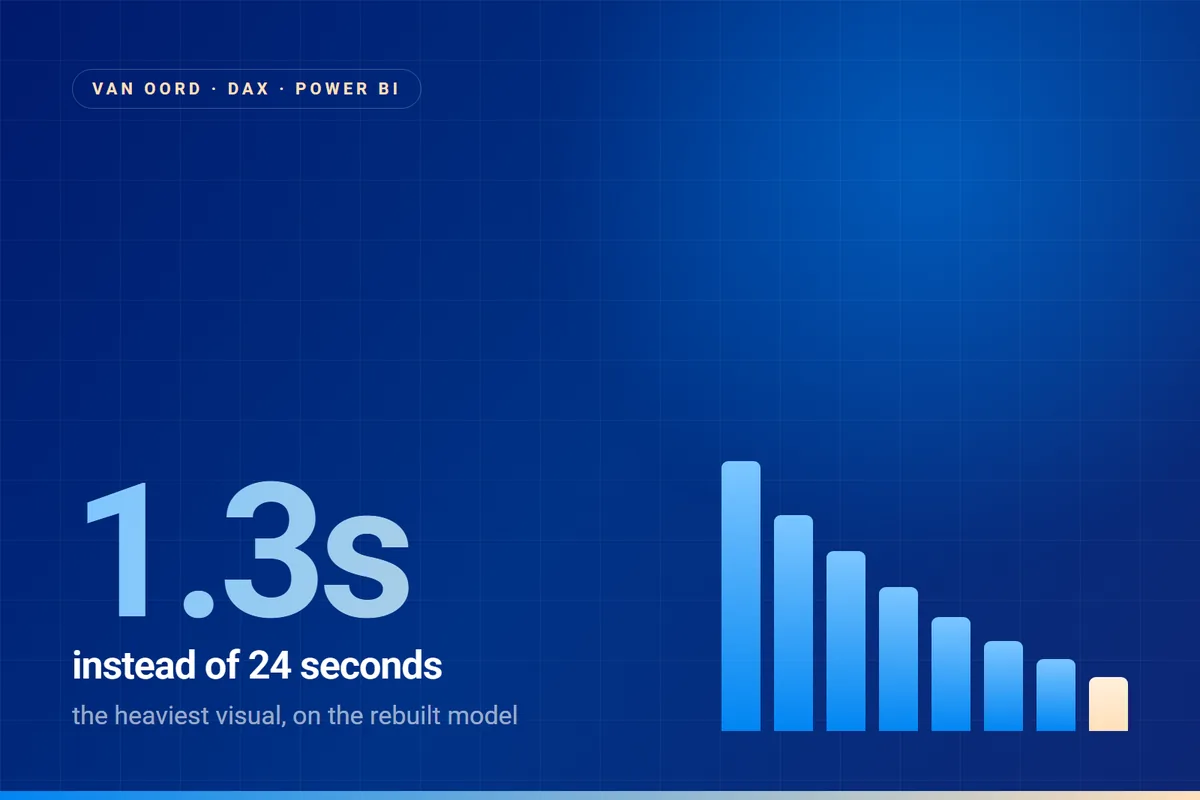
By rebuilding the model rather than buying more hardware. Heavy customisation had produced DAX calculations so complex that the core visual took over 24 seconds to load, against a target of under 700 milliseconds. We remapped the business processes, simplified the data model and rewrote every measure. The heaviest visual now loads in 1.3 seconds.
Marine contracting Power BI, DAX Studio, VertiPaq Analyzer
The challenge
Complex customisation in the client’s Power BI solutions had produced overly complex DAX calculations. The load time of core visuals exceeded 24 seconds, against a target of under 700 milliseconds.
Our approach
We took the data model apart, mapped the business processes carefully and translated them into a simplified model. Every measure was rewritten and optimised using Server Timings. That included a thorough revision of all DAX calculations to raise efficiency and cut load times.
Results
The most complex visual now loads in roughly 1,300 milliseconds, with the majority of visuals under 300 milliseconds. That is a considerable improvement on what was expected.
What came next
The team continued with the production rollout, bringing more projects and team members onto the new, scalable model. That expansion uses the optimised data model to improve project control further.
Expertise involved
DAX Studio, VertiPaq Analyzer, Server Timing optimisation, query plan analysis and Power BI DAX. Alongside that, Kimball modelling and star schema design for an efficient and scalable data architecture. That combination was what made the performance problem solvable rather than something to live with.
See also
Read on
Half an hour is enough to know whether we fit
No slide deck and no quote at the end. We walk through your sources, your definitions and your biggest frustration.
Book half an hourFrequently asked questions
Why was the report so slow?
Not because of data volume but because of the model. Heavy customisation had led to DAX calculations that were far more complex than the question required, and every visual paid for that at runtime.
How did you find out where the time went?
With DAX Studio and Server Timings we measured, per visual, how much time went to the formula engine and how much to the storage engine. VertiPaq Analyzer showed which columns cost the most memory. Only after that did we touch anything.
Did the report pages have to be rebuilt?
No. The report pages largely stayed as they were. The model underneath was rebuilt and the measures rewritten, so users saw the same screen, only fast.